
Classification with Decision Trees
The CART (Classification and Regression Tree) trees are decision trees for classification or regression problems. In the previous article: Regression trees using Python I explain the types of trees and the algorithm for regression, in this new article we will talk about the use of trees for classification.
CART trees were introduced in 1984 and the algorithm is characterized by the display of a series of questions and answers to determine what the next question will be. The main components of these trees are:
- The rules for determining the division of data for each node
- The rules to determine where a branch ends
- Prediction of the objective value in each terminal node
The main advantages of CART trees are:
- It is a non-parametric model so it does not depend on the type of distribution to which the data belongs.
- They are not directly impacted by out-of-range values or outliers.
- It incorporates both training and test data and a cross validation to evaluate the goodness of fit
With all this, a decision tree is a graphic representation of all possible solutions to help make a decision. The basic intuition behind this type of tree is to divide a large data set into smaller subsets under certain rules until you get a set of data small enough to establish a simple label.
Each characteristic that allows to make the division is denoted by a node of the tree while the branches represent the possible decisions. The result of the decision is indicated in a leaf node without branches.
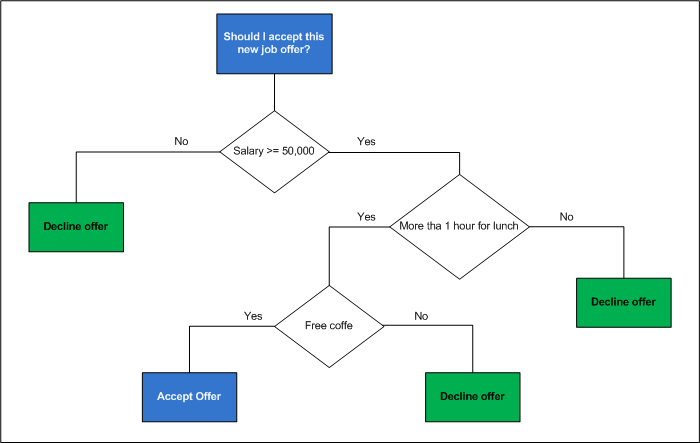
In the previous image we see a decision tree model where we negotiate with a binary classification problem, although in many cases we can have decision trees for multiple classes. In the previous example we have only two decision options, accept or decline the job offer. The branch to select is the one that provides us with the most information to reduce the degree of randomness in our decision.
Finally, the division of data is done with the intention of minimizing entropy and maximizing data groups.
Decision trees with Python
For the example, we use a data file with information about customers who have purchased or not online. If I buy the value of the dependent variable is 1 and if I do not buy, the value is 0. The data in the independent variable are gender, age and estimated salary.
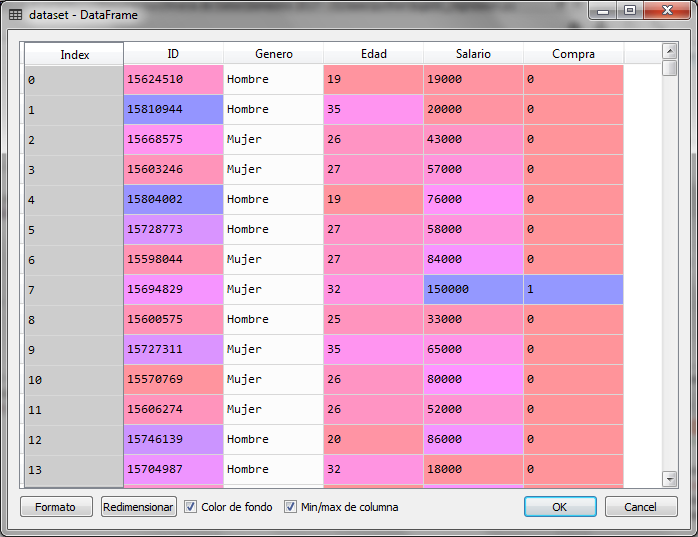
We will use the age and the estimated salary to create a classification tree with the labels of bought (1) or not bought (0) and thus be able to classify new records. For this we create the tree with a set of data that we call the training set.
# Clasification with Decision Trees # Import of libraries import numpy ace np import matplotlib.pyplot ace plt import pandas ace P.S # Importation of the dataset dataset = pd.read_csv ('Compras_en_Linea.csv') X = dataset.iloc [:, [2, 3]]. values y = dataset.iloc [:, 4] .values # Division of data set in training data # and test data desde sklearn.cross_validation import train_test_split X_train, X_test, y_train, y_test = train_test_split (X, y, test_size = 0.25, random_state = 0) # Scale adjustment desde sklearn.preprocessing import StandardScaler sc = StandardScaler () X_train = sc.fit_transform (X_train) X_test = sc.transform (X_test) # We create the Decision Tree for Classification and train it desde sklearn.tree import DecisionTreeClassifier classifier = DecisionTreeClassifier (criterion = 'entropy', random_state = 0) classifier.fit (X_train, y_train)
When executing this piece of code we are loading the data set with 400 customer records of which 25% will be used to test the model and 75% (300 records) for training or to create the tree under the criteria of the age and the estimated salary (columns 2 and 3).
import pydotplus
desde sklearn.tree
import export_graphviz dot_data = export_graphviz (classifier, out_file = None, filled = True, feature_names = ['Age', 'Salary']) graph = pydotplus.graph_from_dot_data (dot_data) graph.write_pdf ('tree.pdf')
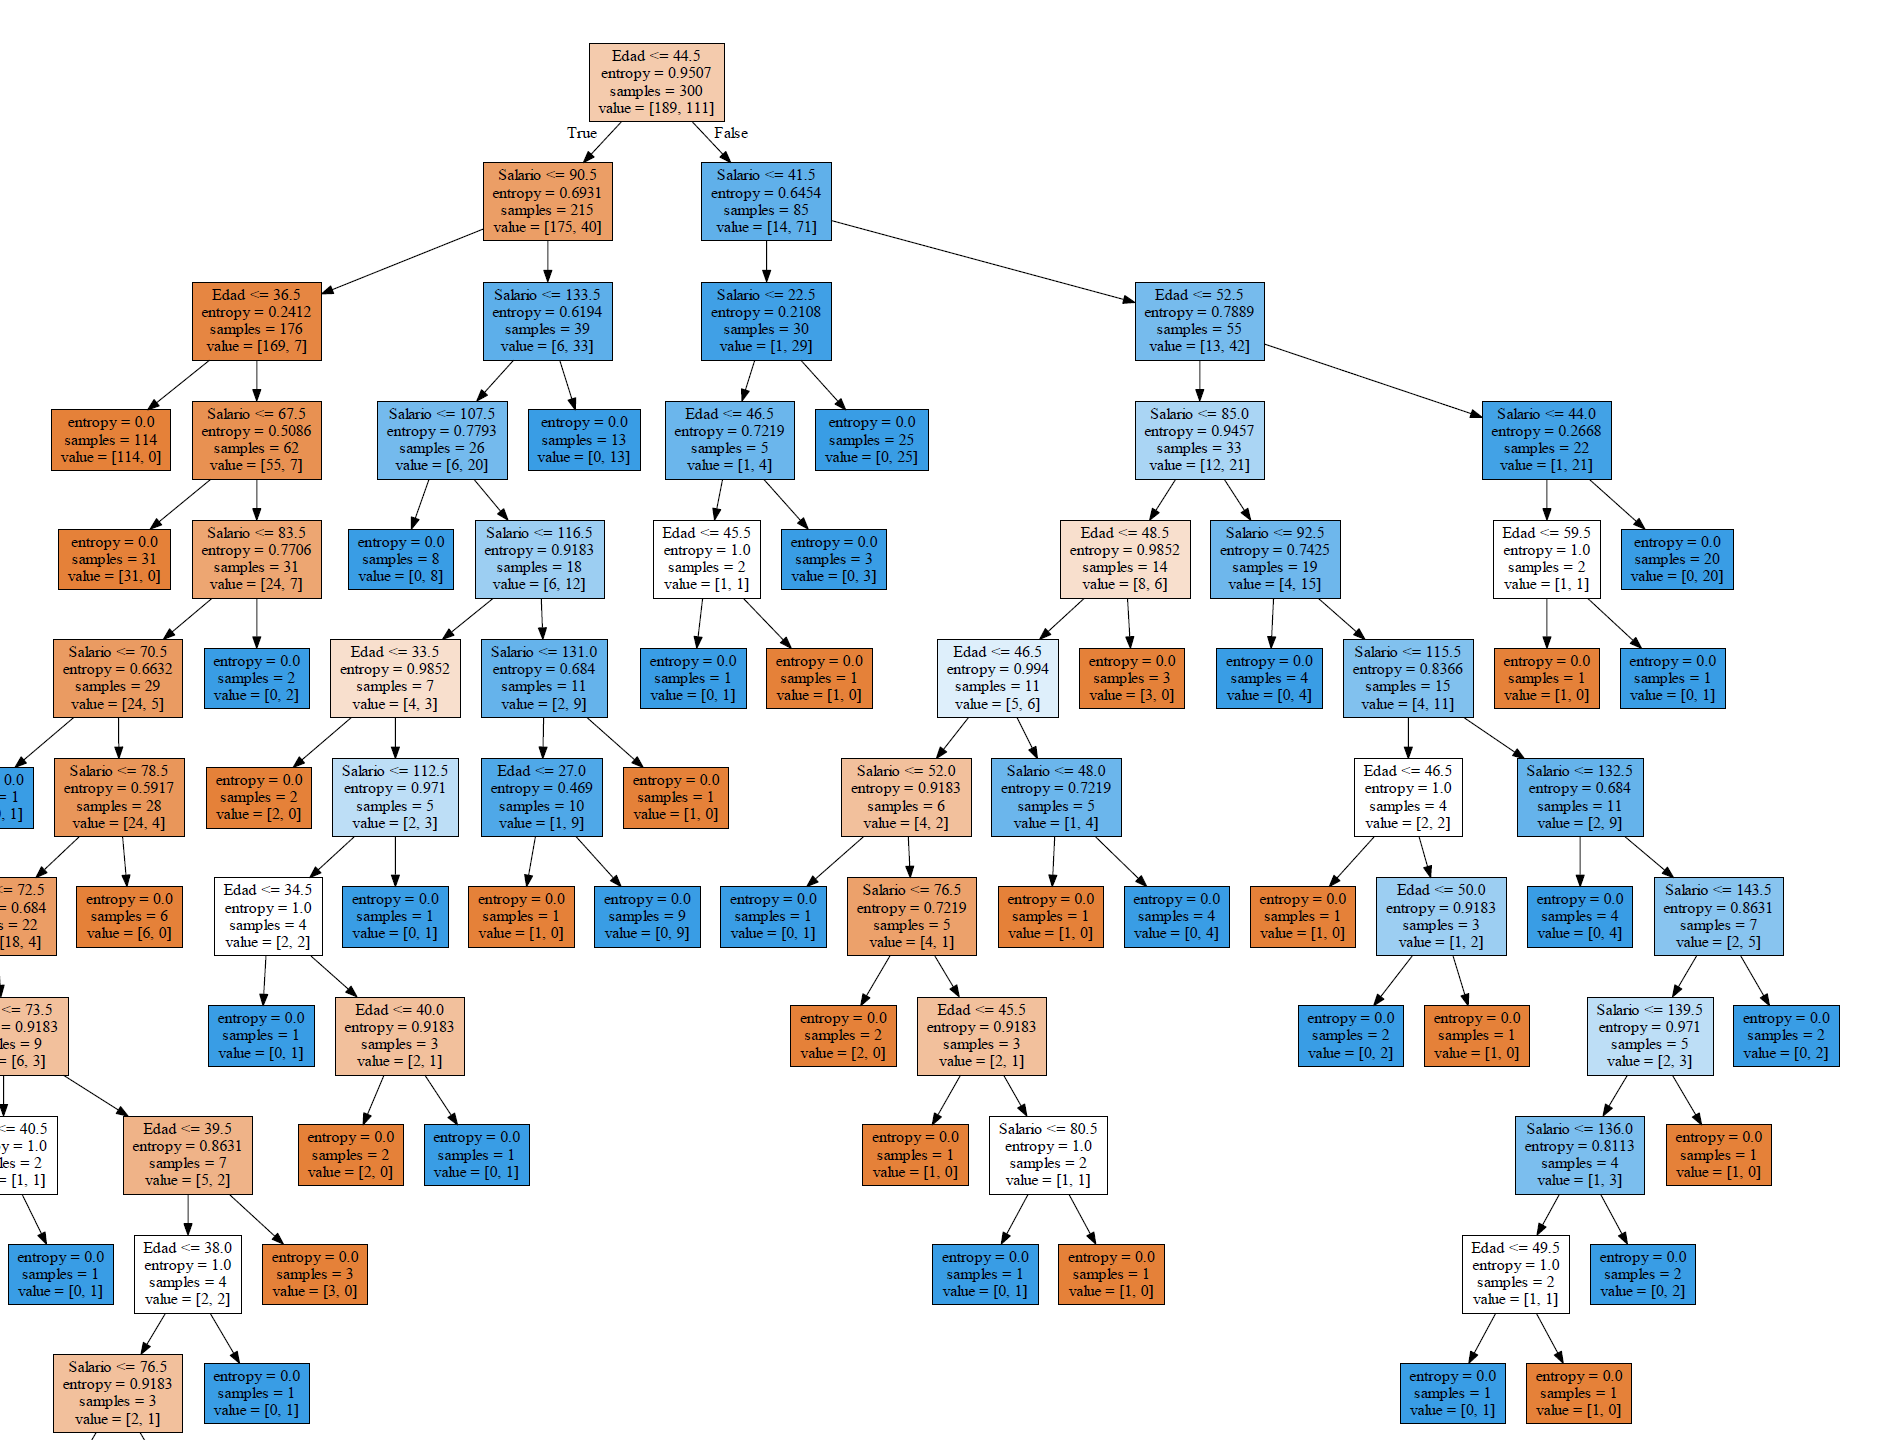
Given the size of the training data set, the tree is too large, but when viewing the image in detail, we observe that each leaf or end node has an entropy value equal to zero. In the same node shows us the number of records that meet the criteria.
If we now adjust the tree for the 100 records in the test set, the resulting graph is smaller and can be seen better.
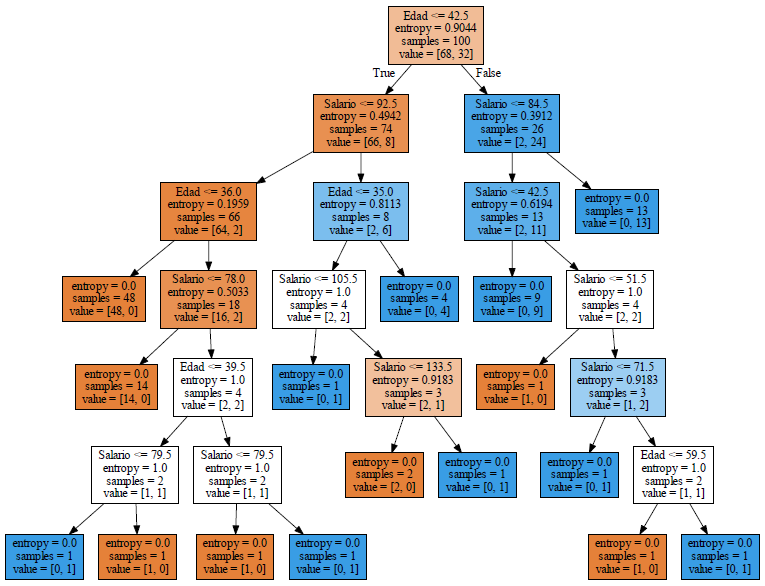
In the final node located on the right side at the third level, it says entropy = 0, samples = 13 and value = [0, 13] is a blue node that indicates that clients older than 42.5 and salary greater than 84.5 if they buy.
Now if we make the prediction for the test set and check the confusion matrix, we have:
# Predicting the Test set results
y_pred = classifier.predict (X_test)

# Making the Confusion Matrix
desde sklearn.metrics import confusion_matrix cm = confusion_matrix (y_test, y_pred)
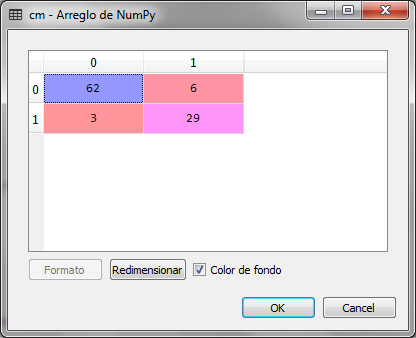
We observe that of 100 records of the set of tests, there are 9 errors, that is, 3 elements that should have been classified with 1 were classified with 0, these represent the false positives. 6 records were classified with 1 and should be classified with 0, the latter represent false negatives.
This implies that the accuracy of the model is 0.91, that is, 91% much better than that which resulted from the same set of tests, Logistic regression of the previous article.
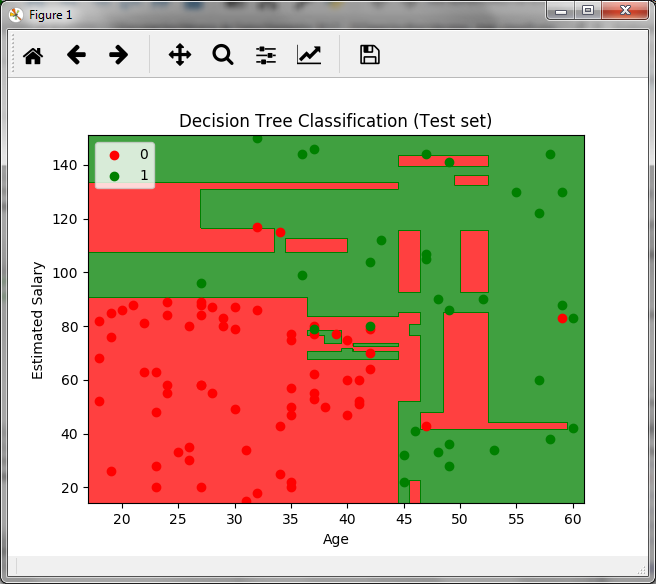
The previous graph is created for the set of tests and in it we see the decision boundaries for the data, the green zone is for customers who do buy and the red zone for those who do not.
Hello, that's an interesting topic to discuss. Agree with an innovation that you share through this article. Could I add some points?
Sure, Go ahead
Hola… Muy buen artículo. Desde dónde puedo descargar los datasets que mencionan???
Hola Jaime,
I'm sorry for answering delay.
Te dejo la liga de una carpeta donde están los datasets
https://drive.google.com/drive/folders/1Jdg2ttdM8pvSdC2ndd5tS5rPI37uTC_t?usp=sharing