
Naive Bayes classifier with Python
Both in probability like in data mining, a naive classifier Bayesiano (clasificador naive bayes) es un método probabilístico que tiene sus bases en el Bayes theorem and receives the name of naive given some additional simplifications that determine the hypothesis of independence of the predictor variables.
Si quieres verlo en video:
The argument of Bayes it is not that the world is intrinsically probabilistic or uncertain, but that we learn about the world through approximation, getting closer and closer to the truth, as we gather more evidence.
In simple terms, the naive classifier of Bayes assumes that presence or absence of a particular characteristic is not related to the presence or absence of any other characteristic. For example, a fruit can be considered as an apple if it is red, round and about 7 cm in diameter.
A classifier naive Bayes considers that each of these characteristics contributes independently to the probability that this fruit is an apple, regardless of the presence or absence of the other characteristics.
In many practical applications, the estimation of parameters for the Bayes models use the method of maximum likelihood, that is, one can work with Bayes' naive model without accepting the Bayesian probability or any of the Bayesian methods.
An advantage of naive Bayes classifier is that only a small amount of training data is required to estimate the parameters needed for the classification (the measures and variances of the variables).
It is only necessary to determine the variances of the variables of each class and not the entire covariance matrix. For others probability models, Bayes naive classifiers can be trained in supervised learning environments.
Bayes theorem
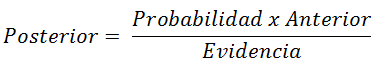
The bayes theorem is expressed by the following equation:
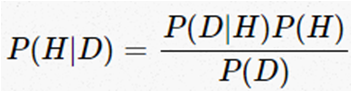
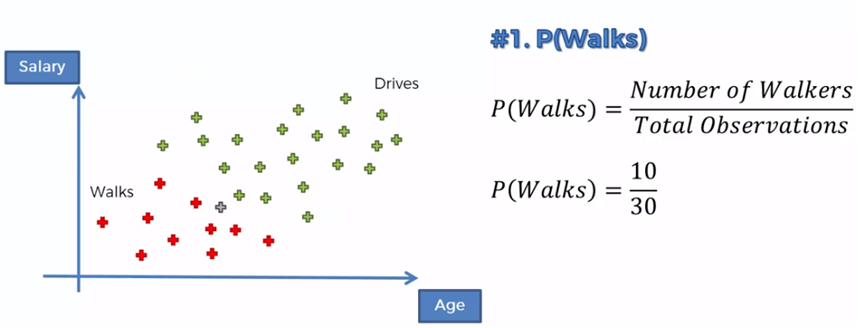
P (H) is the probability a priori, the way to introduce prior knowledge about the values that the hypothesis can take.
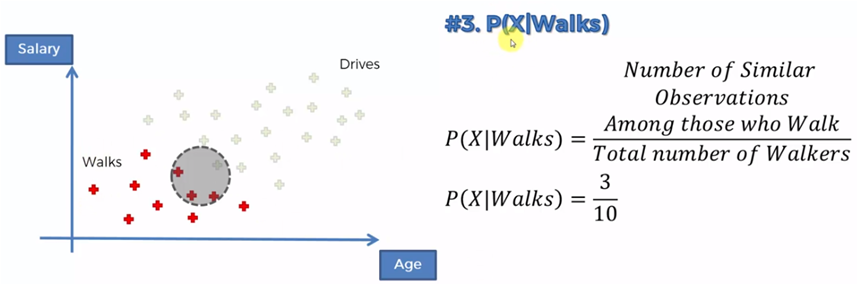
P (D | H) is the likelihood of a hypothesis H given the data D, that is, the probability of obtaining D since H is true.
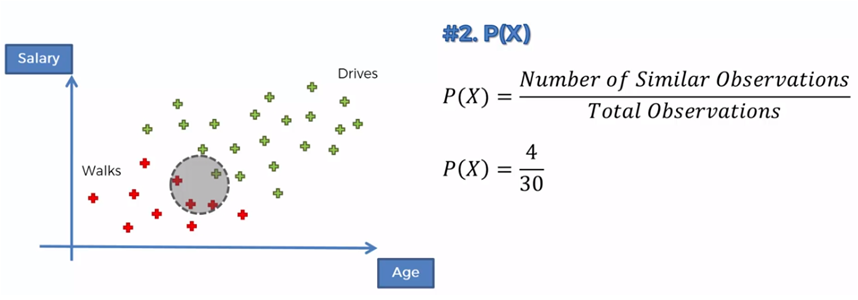
P.S) is the marginal likelihood or evidence, is the probability of observing the D data averaged over all possible H hypotheses.
P (H | D) is the a posteriori, the final probability distribution for the hypothesis. It is the logical consequence of having used a set of data, a likelihood and a a priori.
About a dependent variable H, with a small number of classes, the variable is conditioned by several independent variables D = {d1, d2, ..., dn} which, given the assumption of conditional independence of bayes, assumes that each gave it is independent of any other DJ for i different from j and we can express it in simple terms in the following way:
The formula tells us the probability that a hypothesis H be true if any event D has happened. This is important since, normally, we get the probability of the effects given the causes, but bayes theorem tells us the probability of Causes given the effects.
For example, we can know what is the percentage of patients with flu that have fever, but what we really want to know is the probability that a patient with fever have flu.
Example
We have two machines (m1 and m2) that manufacture the same tool
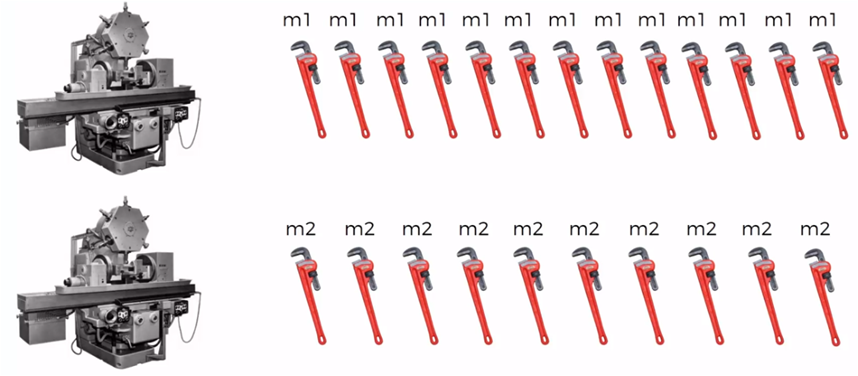
Of all the tools manufactured by each of the machines, some are produced with defects.

If we consider that machine 1 produces 30 keys per hour and machine 2 produces 20 keys per hour, of all the parts produced it is observed that 1% are defective and of all the defective keys 50% come from machine 1 and the 50% of the machine 2.
What is the probability that a defective part was produced by machine 2?
If M1: 30 keys / hour, M2: 20 keys / hour
of the defective 50% are of M1 and 50% of M2
P (M1) = 30/50 = 0.6
P (M2) = 20/50 = 0.4
P (Default) = 1%
P (M1 | Default) = 50%
P (M2 | Default) = 50%
What we want to know is then:
P (Defect | M2) =?
Applying the Bayes Theorem
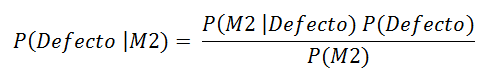
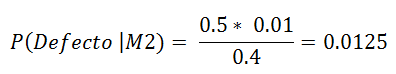
The probability that a defective part is of machine 2 is 1.25%
In a production of 1,000 pieces, then 400 come from machine 2 and if 1% is defective there will be 10 defective parts. of those 10 pieces, 50% are machine 2, that is, 5 pieces, we can verify that the percentage of defective parts of machine 2 is 5/400 = 0.0125
Algoritmo del Clasificador Naive Bayes
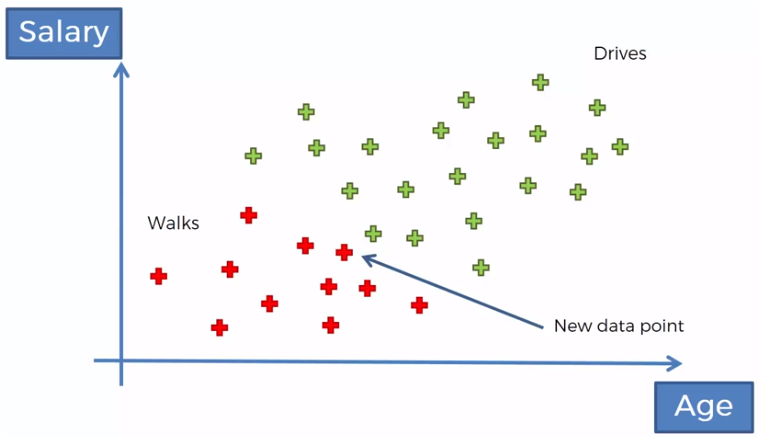
We have a set of data of people who walk or drive towards their work, in relation to their age and their salary, for example.
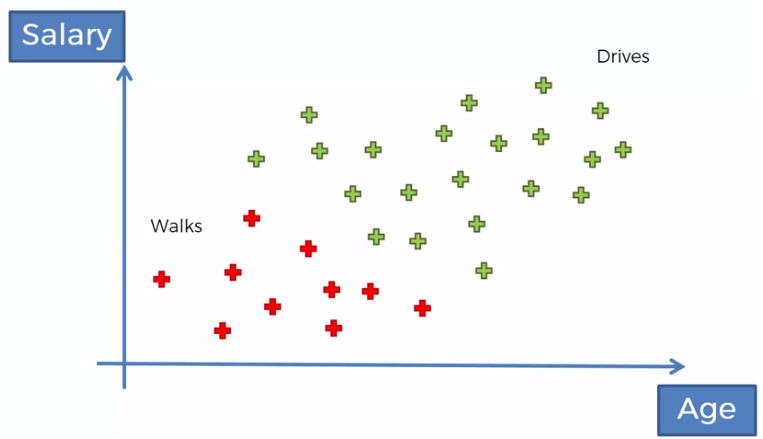
If we now have the age and the salary of a new person, we want to classify it, according to that data, if it is of the people who walk or of those who drive.
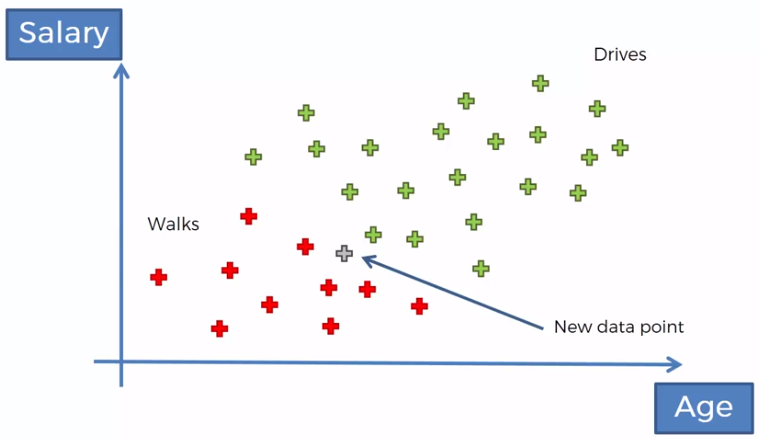
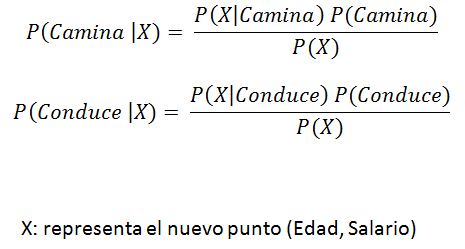
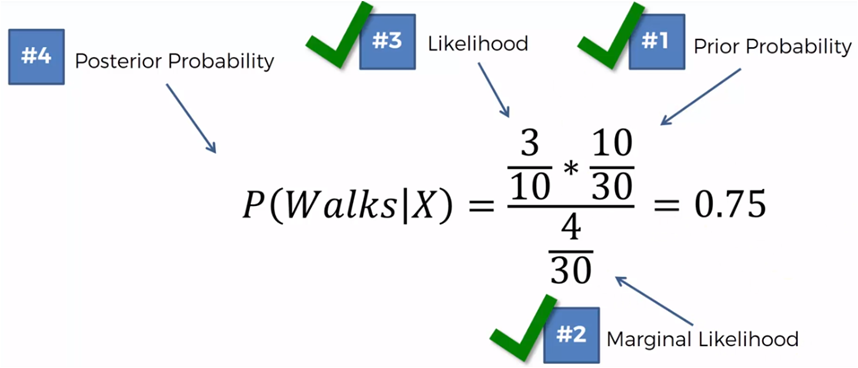
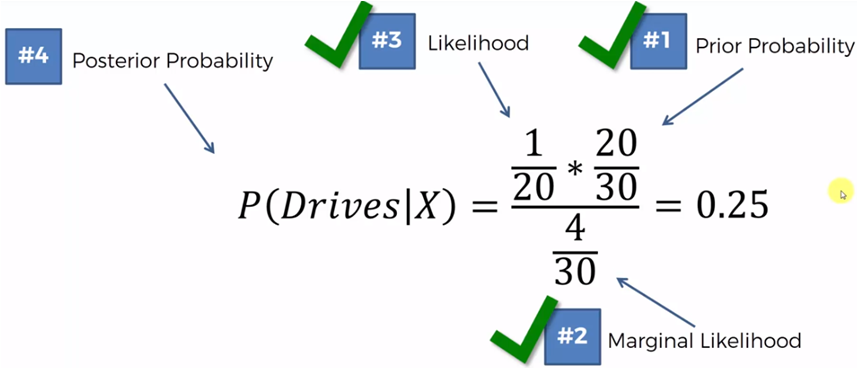
If we now compare those who walk against those who drive we must:
P (Walk | X)> P (Drive | X)
0.75> 0.25
Then, this new point that represents the age and salary of a new person, will be classified in the group of those who walk.
Naive Bayes with Python
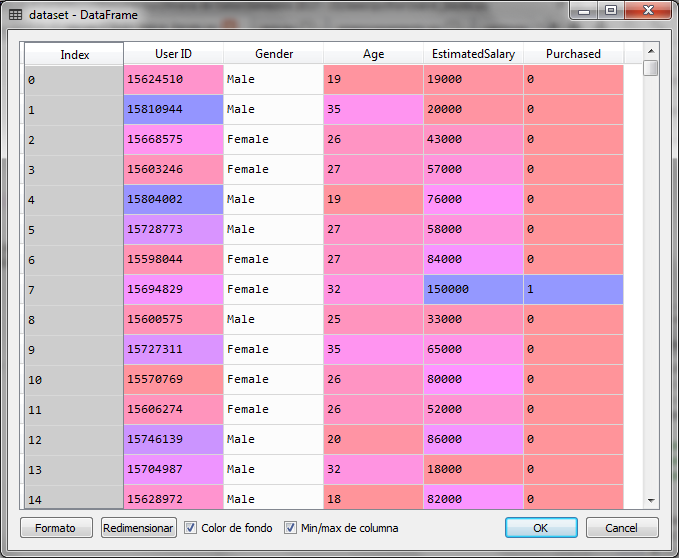
For the exercise with python We will use a set of data with information of customers who bought or did not buy in a store in relation to their age and their salary mainly.
Conclusions
To delve more about the subject and start with python, this video guide is very good and allows you to go from the basics to the intermediate: Video Guide
This other more advanced one includes analysis with pandas and other libraries of frequent use: Live lessons
Additionally, the basics of data analysis with python can be found in this training video.
You can also take training in data science and pay when you have got the job as a data scientist, this is an excellent offer: Training in data science
Finally, the certification AWS Associate or AWS Professional They are very accessible and indispensable tools in the subject.
A very interesting webinar about Azure is the following: Webinar Azure
Data analytics with Spark using Python
Hello, that such an interesting article. What is the most advantage of using this approach than others?
I think the main advantage on this approach is the probability of causes instead of efects, when other techniques are focused on the probability of efects
what about naive? why?
Because is an interesting aproach to classify
do you have book for reference?
whats the next post?
Hello,
Yes, these are two interesting books you can use as reference:
Mastering Machine Learning with Python in Six Steps, Author: Manohar Swamyathan. Apress
https://www.apress.com/gp/book/9781484228654
and
Automated Machine Learning, Methods, Systems, Challenges, Authors: Frank Hutter, Lars Hotthof, Joaquin Vanschoren. Springer
https://www.springer.com/gp/book/9783030053178
The next post is Association Rules Learning: https://www.jacobsoft.com.mx/es_mx/aprendizaje-con-reglas-de-asociacion/
Yes naive is a good approach, I can watch the post
this algorithm is rather difficult to understand, is there a basis?
Yes, It is and there is one here
What is Naive Bayes classifier with Python for?
It is a probabilistic classifier based on Bayes Theorem and is also a supervised learning algorithm which can use a small dataset so estimate parameters like mean and variance needed for the classification process, that’s why using python could help to implement solutions for every kind of problem
hola nos podrias compartir el archivo csv
hola buenas noches me podrias compartir el archivo Social_Network_Ads.csv
al correo davilamaicol@hotmail.com
Hola
Perdón por la tardanza en responder. Descarga el archivo de esta liga
https://drive.google.com/file/d/17Eb2XNuR9byDl7W5H22AoE8CBLGUO4YS/view?usp=share_link
Hola,
Te paso la carpeta con los datasets de los post.
Saludos
https://drive.google.com/drive/folders/1Jdg2ttdM8pvSdC2ndd5tS5rPI37uTC_t?usp=share_link
https://drive.google.com/file/d/17Eb2XNuR9byDl7W5H22AoE8CBLGUO4YS/view?usp=share_link
https://drive.google.com/file/d/17Eb2XNuR9byDl7W5H22AoE8CBLGUO4YS/view?usp=share_link