k-Means Clustering with Python
As described in the previous article: Cluster Analysis, the k-Medias method is a non-hierarchical method based on centroids, robust and easy to implement, where it is necessary to specify in advance the number of groups that will be generated and to which the data will be assigned.
Additionally, these types of methods are recommended for large amounts of data.
Checa el tema en video
The dataset utilizado en el ejemplo lo puedes descargar de este enlace: dataset
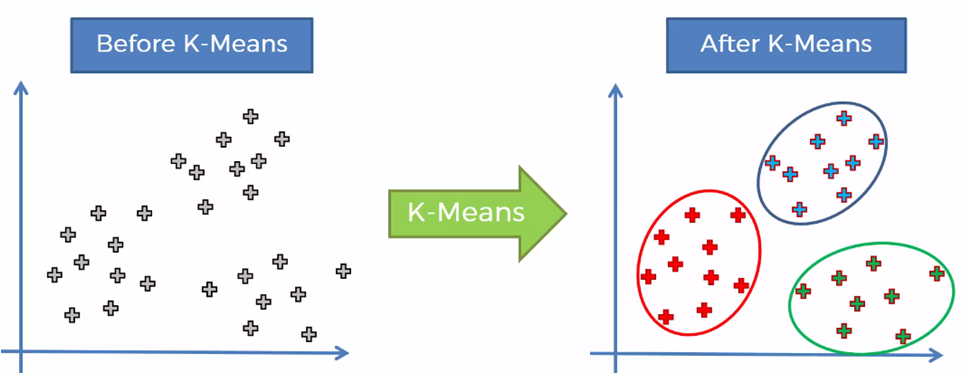
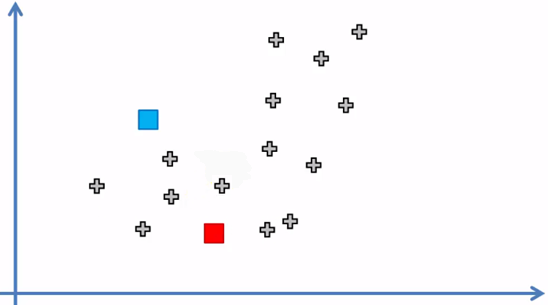
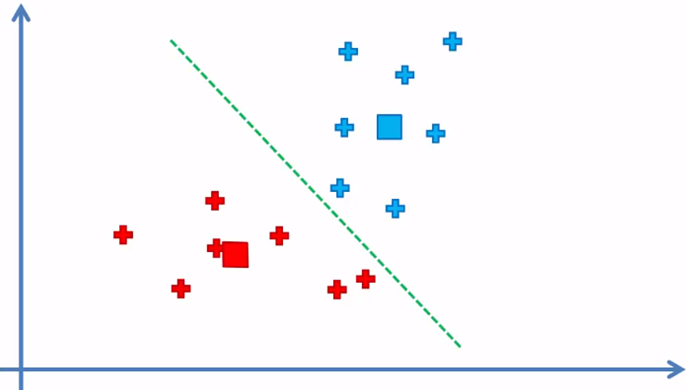
The algorithm works in the following way: suppose we have the next set of data.
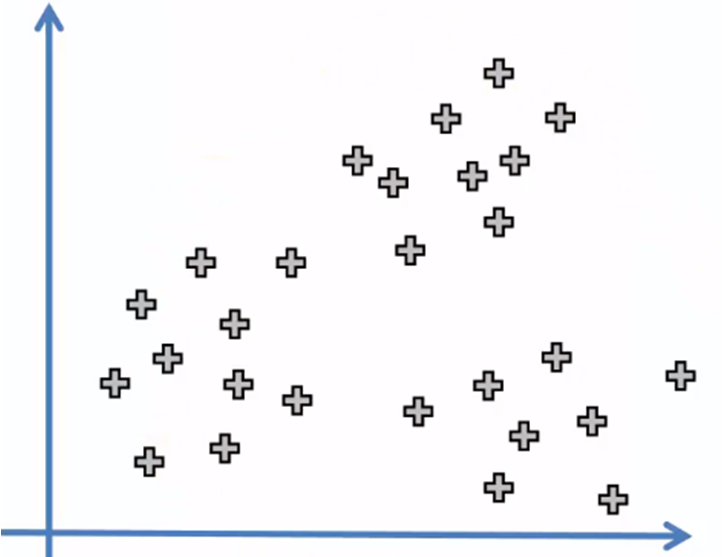
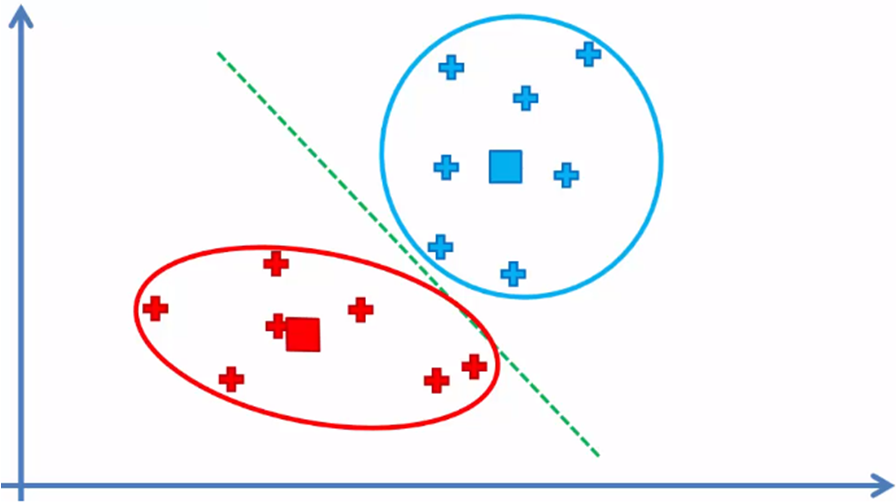
When applying the algorithm, we must obtain the following result:
To get there, the procedure followed by the algorithm is as follows:
K-Means Algorithm 1. Select the number of k groups (clusters) 2. Randomly generate k points that we will call centroids 3. Assign each element of the data set to the nearest centroid to form k groups 4. Reassign the position of each centroid 5 Reassign the data elements to the nearest centroid again 5.1 If there were elements that were assigned to a centroid other than the original, return to step 4, otherwise the process is overTo understand clearly the previous algorithm, let's go step by step describing it graphically:
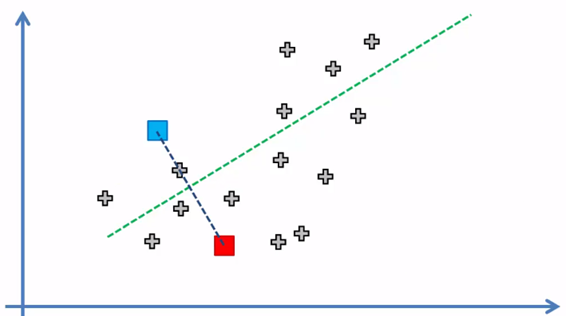
1. Select the number of k groups
For this data set, let's say that k equals 2. (We'll see how to select k later).
2. Randomly select k points that we will call centroids (k = 2)
The blue and red dots represent the two centroids located randomly in the space of the data set.
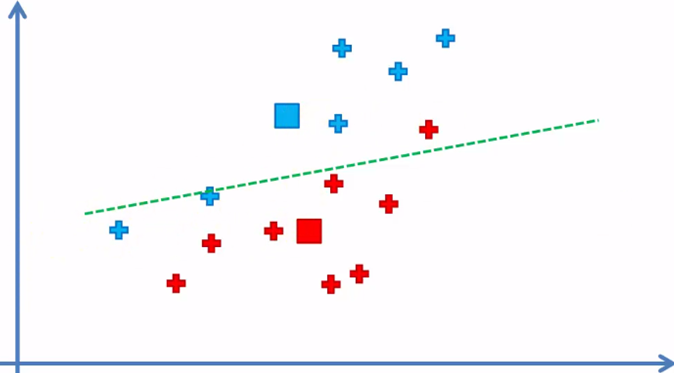
3. Assign each element of the data set to the nearest centroid to form k = 2 groups
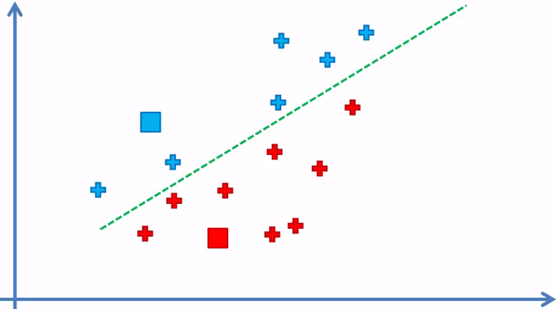
Each element was assigned to the centroid closest to it and in this way the k = 2 groups or clusters are formed, now the next step:
4. Reassign the position of each centroid
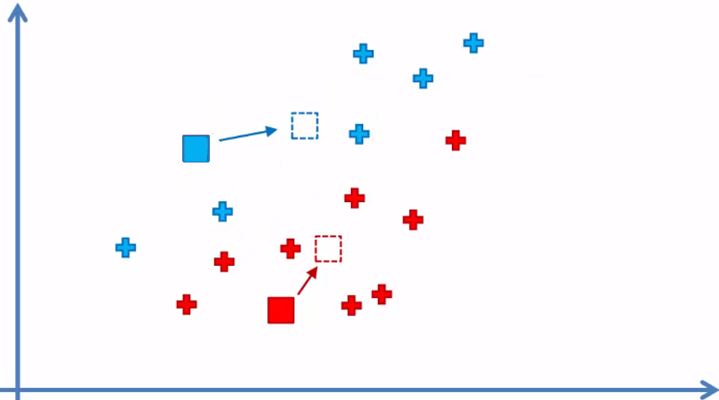
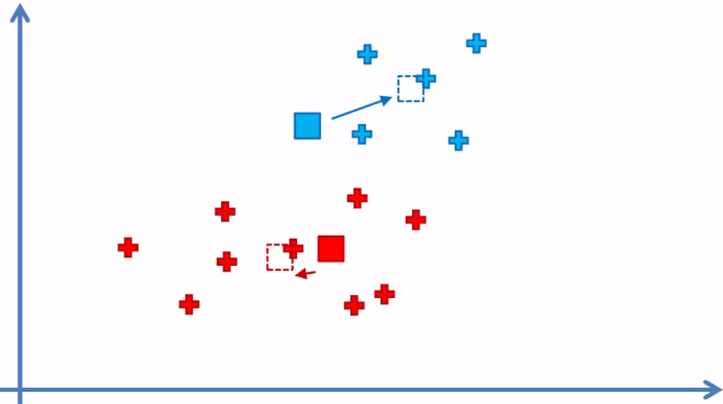
5. Reassign the data elements to the nearest centroid again
As we can see, there are blue elements that are now closer to the red centroid and a red element on the side of the blue centroid border, so these elements will be reassigned.
5.1 If there were elements that were assigned to a centroid other than the original, we return to step 4
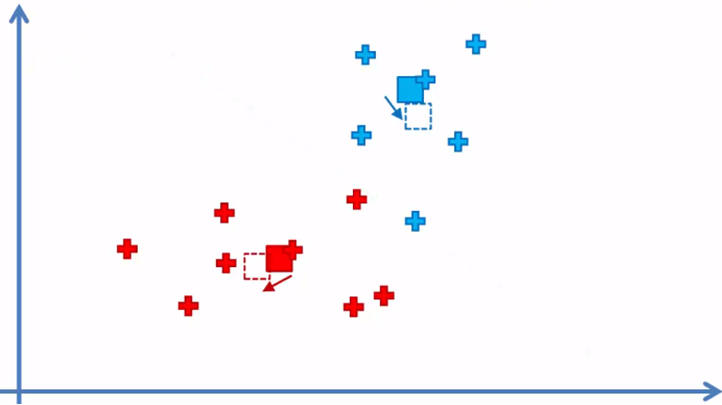
Since there were reassigned elements, we return to step 4 and change the position of the centroids
Step 5 again and we reassign
We return to step 4 again
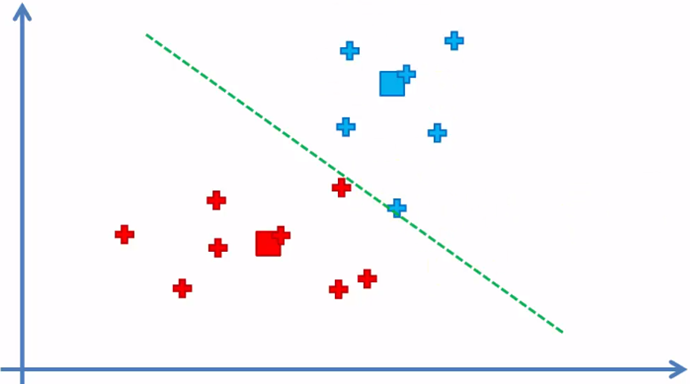
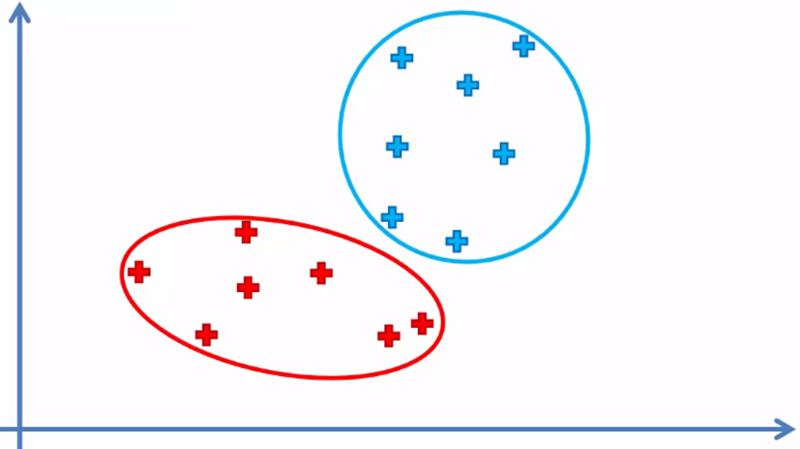
and the algorithm continues between step 4 and 5 until there are no elements that have to be reassigned from the cluster
When there are no elements that changed cluster, the model has finished and we have the two clusters with their respective elements of the data sample.
Since the centroids are not part of the data set, they are not taken into account.
As you can guess, the initial position of the centroids can influence the final grouping of all elements and this generates more than one solution for the same number of clusters
For example, for the same data set, we could have two or more groups of data elements, depending on the initial position of the centroids. In the following comparison picture, we have k = 3 and two final options for the same data set:
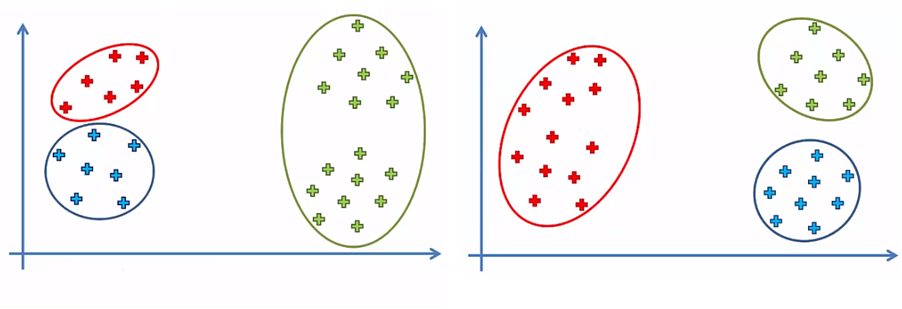
This ambiguity is solved with a small modification to the k-Means algorithm that makes it k-Means ++
Selection of the correct number of clusters k
To determine the optimal number of clusters that can be held in a data sample, there are several practical methods, both formal and graphical, that can be used, but one of the most common and robust techniques is the elbow method.
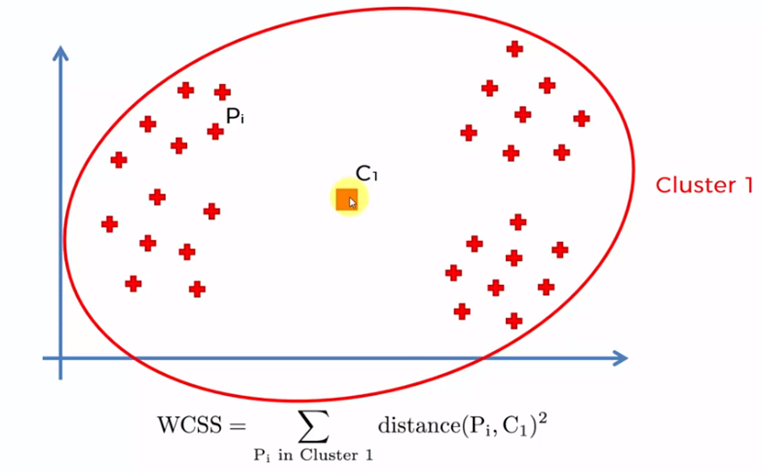
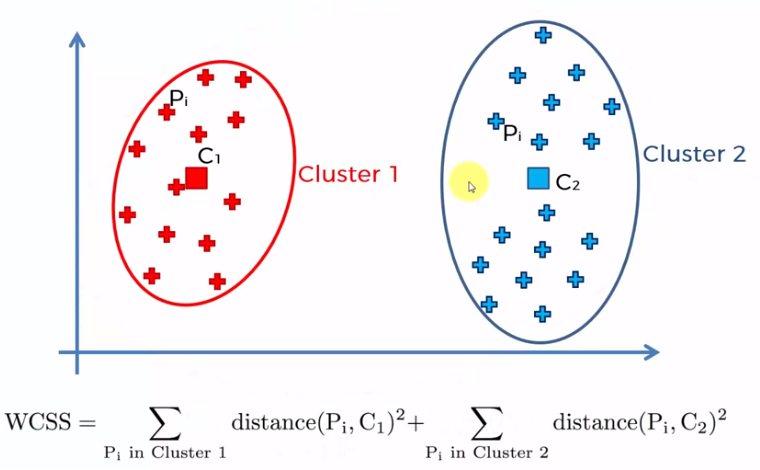
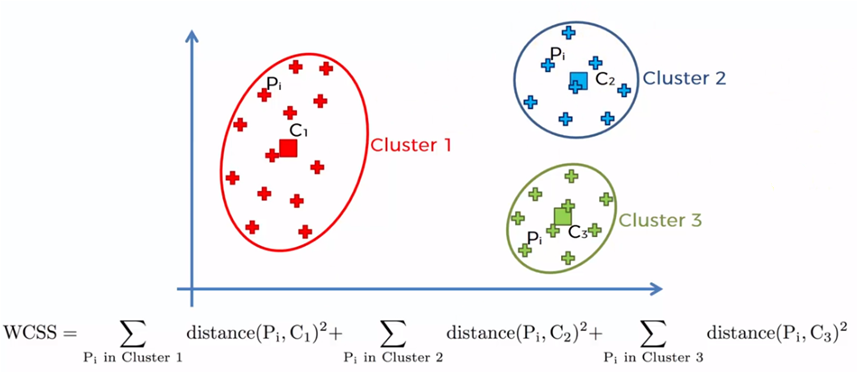
The elbow method is based on the sum of the squares of the distances of each data element with its corresponding centroid and is denoted as follows:
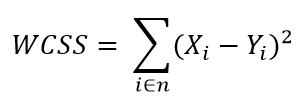
Where WCSS is the sum of the squares of the distances and refers to Within-Cluster-Sum-of-Squares, Yi is the centroid of the element or data Xi and n the total data in the sample.
The process is carried out by starting with a single cluster for all the elements of the sample and the sum of all the distance of each element is obtained with the centroid, later two centroids are created and the closest elements to each one are added. the centroids to add the distances of each element with its corresponding centroid. The process is repeated for 3, 4, 5 ... n centroids. When the number of centroids is equal to the amount of data in the sample (n), the distances are zero, since each element is a centroid.
Each of these values of WCSS for each case, that is, 1 centroid, 2 centroids, etc. It is graphed and we obtain a graph similar to the following:
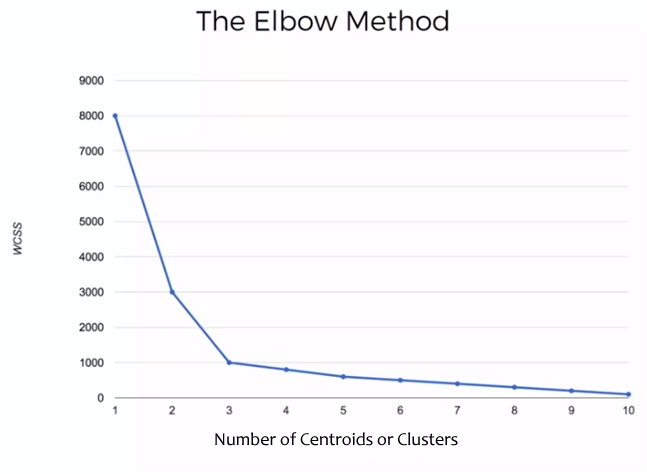
In this example, the sum of the distances for 1 to 10 clusters and / or centroids was calculated.
The graph shows that the sum of the distances decreases as the number of clusters increases and that decrease decreases as the number of clusters increases. The point where an elbow is made and the change in the value of the sum of the distances is significantly reduced, is the value that tells us the optimal number of clusters that the sample should have. In this case the optimal point is 3
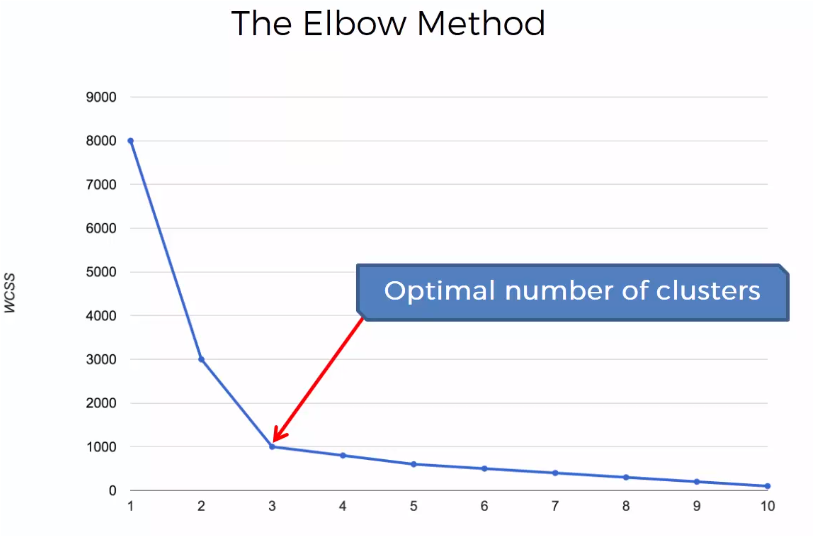
To generate the graph, it is not necessary to generate the centroids n, when n is the number of samples in the data set, an estimated value that allows to visualize the graph with the elbow will be sufficient to determine that optimum number for the clusters that will generate the k-Means method.
Implementation of k-Means with Python
The dataset utilizado en el ejemplo lo puedes descargar de este enlace: dataset
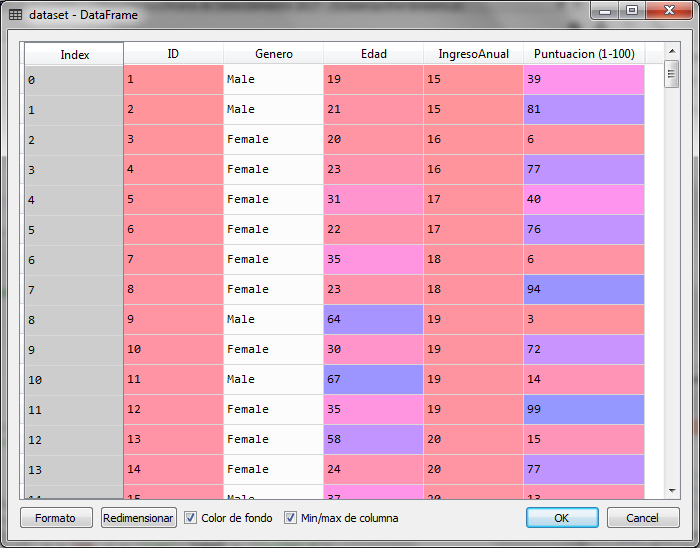
For this example with python, we will use a sample of 200 data from a store that has rated its customers with a score ranging from 1 to 100 according to their purchase frequency and other conditions that the store has used to qualify its customers. with that score. In the data set we have information about the gender, age and annual income in thousands of the client. However, to be able to graph the results we will only use the annual income and the score to generate the groups of clients that exist in this sample and analyze said result.
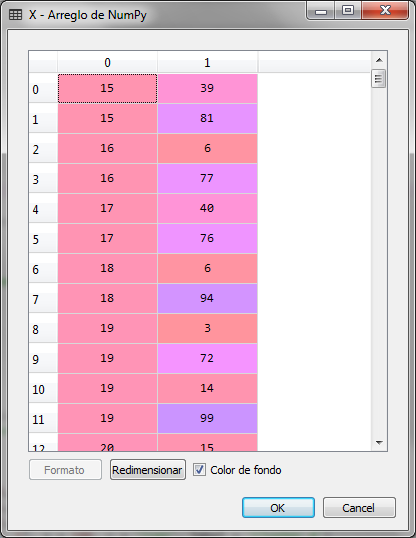
# K-Means Clustering # Import of libraries
import numpy ace np
import matplotlib.pyplot ace plt
import pandas ace P.S

# Loading the data set
dataset = pd.read_csv ('Customers_Shop.csv') X = dataset.iloc [:, [3, 4]]. Values
We import the libraries and load the data set, indicating that the variable to be analyzed is a matrix with columns 3 and 4 of the data set, which correspond to the annual income in thousands and the customer's score.
The matrix of X is as follows:
Our next step will be to create the graph for the elbow method and determine the optimal number of clusters that exist in the sample according to the income and the score that the store assigned to each of the clients.
# Eldo method to find the optimal number of clusters

desde sklearn.cluster import KMeans wcss = []
for i in range (1, 11): kmeans = KMeans (n_clusters = i, init = 'k-means ++', random_state = 42) kmeans.fit (X) wcss.append (kmeans.inertia_)

# Graph of the sum of the distances
plt.plot (range (1, 11), wcss) plt.title ('The Elbow Method') plt.xlabel ('Number of clusters') plt.ylabel ('WCSS') plt.show ()
In the previous block, we generate the clusters for values from 1 to 10 (in the range of 1 to 11) and obtain for each of them, the sum of the distances with the inertial tribute_ of the kmeans object. The graph obtained is the following:
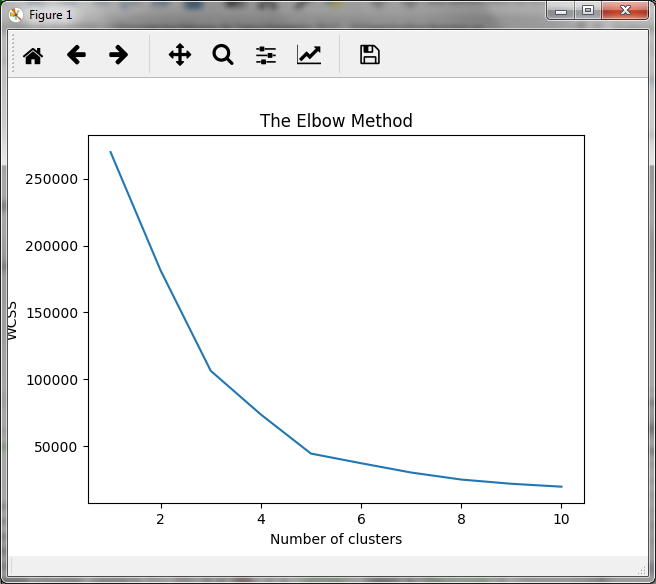
In the graph we observe that the decrease in the sum of the distances is attenuated when the number of clusters is equal to 5, so, for this practical case, the optimum number of clusters will be 5.
With this, we now generate the model for 5 clusters with the object kmeans
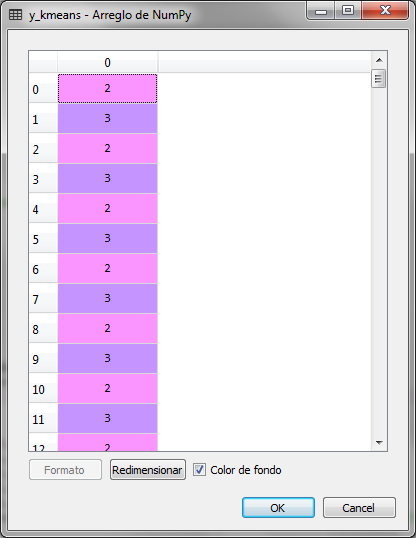
# Creating the k-Means for the 5 groups found
kmeans = KMeans (n_clusters = 5, init = 'k-means ++', random_state = 42) and_kmeans = kmeans.fit_predict (X)
the y_kmeans variable stores the groups corresponding to each row of the data sample, which means that each record corresponding to a client is assigned to one of five groups ranging from 0 to 4
In order to graphically observe the assignment of the 200 clients to 5 groups or clusters, we did the following, we assigned a color to each group and we marked the centroids in yellow:
# Graphic visualization of the clusters
plt.scatter (X [y_kmeans == 0, 0], X [y_kmeans == 0, 1], s = 100, c = 'net', label ='Cluster 1') plt.scatter (X [y_kmeans == 1, 0], X [y_kmeans == 1, 1], s = 100, c ='blue', label ='Cluster 2') plt.scatter (X [y_kmeans == 2, 0], X [y_kmeans == 2, 1], s = 100, c ='green', label ='Cluster 3') plt.scatter (X [y_kmeans == 3, 0], X [y_kmeans == 3, 1], s = 100, c ='cyan', label ='Cluster 4') plt.scatter (X [y_kmeans == 4, 0], X [y_kmeans == 4, 1], s = 100, c ='magenta', label ='Cluster 5') plt.scatter (kmeans.cluster_centers_ [:, 0], kmeans.cluster_centers_ [:, 1], s = 300, c ='yellow', label ='Centroids') plt.title ('Clusters of customers') plt.xlabel ('Annual Income (k $)') plt.ylabel ('Spending Score (1-100)') plt.legend () plt.show ()
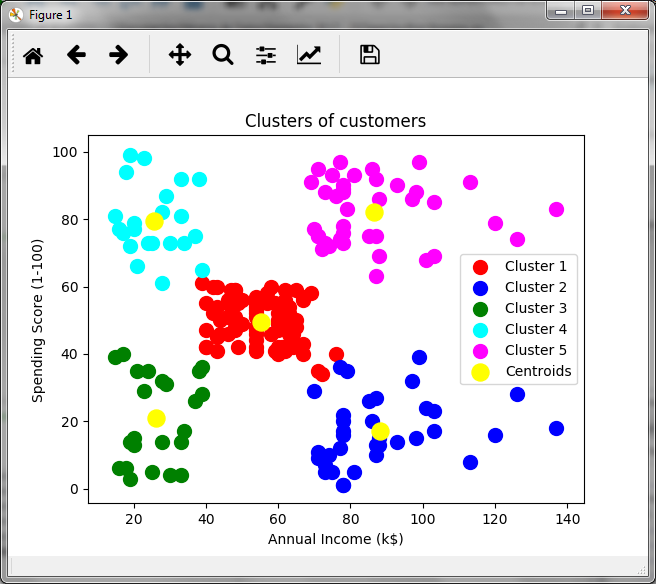
In relation to the annual income in thousands and the score generated by the store, we observed a group of customers that could be of interest to the store. The group of customers in purple, which have high income and a high score, so they could be a target group for certain promotions. In green we have low-scoring and low-income clients, while in blue, we have low-income clients with high scores, which could indicate that these customers buy a lot despite low incomes. That is, cluster analysis allows making inferences and making decisions.
In the next article, we solve the same case but with the hierarchical method
[...] k-Means Clustering with Python [...]
[...] the previous article k-Means Clustering solve the same case but with the method k-Means and get the same [...]
Where you can download the data (Customers_Tienda.csv), to run the model
Hello Jorge, sorry for the delay in answering, I send the file to your email
Friend, help me with the data enriquemacias21@hotmail.com. Thank you so much. Excellent contribution
Of course, Enrique, I just sent it to your email. regards
Hola amigo, donde puedo obtener los datos de los clientes.
Como puedo obtener los datos de los clientes?
Hola José, te los acabo de enviar al correo. Confirmame si ya lo recibiste
Que tal José,
Te acabo de enviar un correo con el archivo
Muchas gracias por el artículo. Podría disponer del csv de origen, por favor? gracias
Que tal German,
Si claro, te lo acabo de enviar por correo
Hola,
Te lo acabo de enviar por correo
Saludos
Jacob
Me regalas por favor el dataset
Buenos días,
Me haces el favor de regalarme el dataset, muchas gracias.
Hola,
Claro que si, te paso la liga para descargar el archivo de datos
https://drive.google.com/file/d/1d0P1elh1B3lX9g3tE981ZWpZLRl9zAt_/view?usp=sharing
Hola,
Claro que si, te dejo la liga para descargar el archivo de datos
https://drive.google.com/file/d/1d0P1elh1B3lX9g3tE981ZWpZLRl9zAt_/view?usp=sharing
Muy bueno el tutorial, podrías enviarme los datos que usas Clientes_Tienda.csv. Saludos y gracias
Que tal Enrique,
Te dejo la liga para descargar el archivo de datos
https://drive.google.com/file/d/1d0P1elh1B3lX9g3tE981ZWpZLRl9zAt_/view?usp=sharing